Transportation Analytics and Reporting for Operators
Configurable dashboards, standard transit KPIs, grant-ready exports, and compliance reporting, all built into the platform your dispatch team already uses.
Every trip, every route, every rider interaction generates data. SHARE turns that data into reports your team, your funders, and your clients actually need.
Reporting shouldn't take longer than running the service
When data lives in spreadsheets, inboxes, and driver logs, pulling a monthly report becomes a multi-day project instead of a five-minute task.
01
Manual data assembly for monthly reports
Staff spend hours pulling trip counts, driver hours, and ridership numbers from disconnected systems. By the time the report is compiled, the data is already stale.
02
No real-time visibility into program KPIs
Without a live dashboard, operators only see performance metrics after the reporting period ends. Problems that could have been caught in week one surface in the month-end summary.
03
Grant and NTD reporting requires spreadsheet workarounds
Federal funding agencies require specific metrics in specific formats. Without built-in compliance exports, coordinators manually reshape data to fit NTD templates and grant requirements.
04
No way to segment data by service type or time period
When demand-response and fixed-route data are combined in one spreadsheet, isolating performance by program, vehicle, or date range means building new pivot tables every time.
Dublin Connector, City of Dublin, Ohio
29,900+
rides completed
80%
priority ridership from seniors and residents with disabilities
What It Does
The reporting layer operators wish they had years ago
Standard transit KPIs, contract-specific metrics, and compliance exports, all generated automatically from dispatch data.
Configurable KPI dashboards
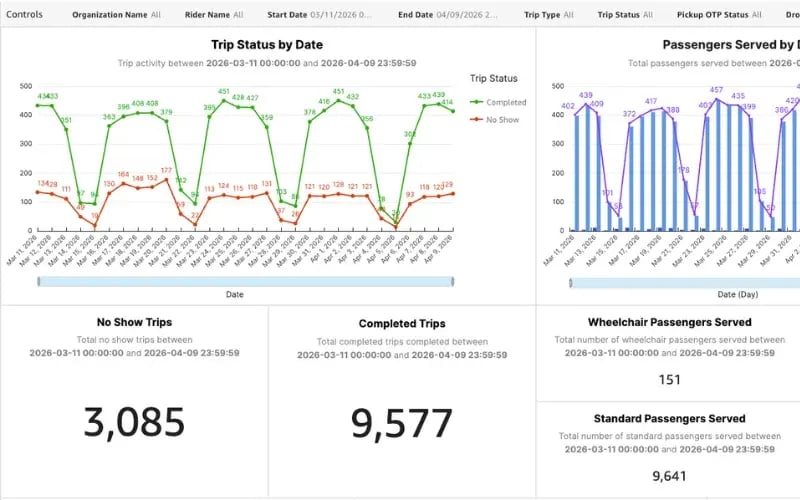
SHARE builds custom dashboards with each customer, focused on the specific KPIs that matter to your program. OTP, riders per vehicle, cost per ride, and more, visible at a glance.
Ridership and trip volume reports
Track total trips completed, unique riders served, new signups, repeat rides, and no-shows. Filter by organization, date range, or service type to isolate exactly what you need.
On-time performance tracking
Measure pickup and drop-off OTP with dedicated status filters. See average rider wait time, average drop-off deviation, and ride duration across your entire fleet or a single route.
Cost per trip analysis
Break down total trip costs with detailed fare payment reports covering card, cash, and credit transactions. Route revenue data helps you understand cost efficiency by route, vehicle, or driver.
NTD and grant compliance exports
Generate reports formatted for federal funding compliance, including NTD submissions. ADA trip counts, passenger demographics, and vehicle utilization data are tracked automatically.
Vehicle utilization metrics
Track utilization miles, utilization hours, total operating hours, and riders per vehicle. Identify underused assets and optimize fleet deployment with data, not guesswork.
Data export (CSV, Excel)
Export any report to CSV or Excel for offline analysis, board presentations, or integration with external tools. Every report table supports direct export with all applied filters preserved.
Multi-program and multi-client reporting
Operators managing multiple programs or client accounts filter reports by organization. See aggregate performance across your portfolio or drill into a single program.
How It Works
From dispatch data to stakeholder-ready reports
No manual data entry. No spreadsheet assembly. Reports build themselves from the operations you already run.
1
Data flows in automatically from dispatch
Every trip, route, driver action, and rider interaction is captured in real time as your service operates. No manual logging required.
2
Dashboards update in real time
KPI dashboards reflect live operational data. On-time performance, ridership, vehicle utilization, and cost metrics stay current without manual refresh.
3
Export or schedule reports for stakeholders
Pull reports for grant compliance, client updates, or board presentations. Export to CSV or Excel with filters applied, ready to share.
See reporting and analytics configured for your program in a live walkthrough.
SHARE tracks on-time performance, total trips completed, unique riders served, average riders per vehicle, average ride time, vehicle utilization (miles and hours), total operating hours, average rider wait time, no-shows, cancellations, rider satisfaction scores, and cost per ride. Dashboards are configurable, so your team sees the metrics that matter most to your program.
Yes. SHARE captures the ridership, vehicle utilization, and accessibility data that NTD submissions require. Reports can be exported in formats compatible with federal reporting requirements. ADA trip counts, passenger totals, and vehicle hours are tracked automatically as part of normal operations.
Yes. SHARE builds custom insight dashboards with each customer, focused on the specific metrics their funding sources require. Section 5310 and Section 5307 programs have different reporting needs, and the platform adapts to match. All data exports to CSV or Excel for integration with external grant reporting workflows.
Every report in SHARE supports direct export to CSV or Excel. Applied filters carry through to the export, so you get exactly the data subset you need. Reports default to a 30-day window, and date and time columns adjust to your device timezone automatically. Exported data can be used for board presentations, grant submissions, or analysis in external tools.
Get Started
Better data. Better decisions. No spreadsheet assembly.
See how SHARE's reporting and analytics work for your program type and funding requirements in a live walkthrough.